WordPress is one of the most popular content management systems (CMS) available on the market today. It is built on various development languages, which are based on PHP. Every time a user visits a WordPress site, the PHP code is compiled by the PHP module installed on the server (Apache or Nginx). Essentially, this means that a lot of PHP errors can occur during the processing of user requests. If so, it indicates a problem with the PHP code. Hence, you must understand the basic knowledge of how to check for these PHP errors before looking for a solution. In this article, we will explain how to debug PHP errors on a WordPress site and also enable error logging.
PHP errors in WordPress
PHP errors can be a warning or a fatal error that breaks your site. These issues can occur for a variety of reasons, as listed below.
- Omitting a semicolon in syntax
- Calling the wrong variable
- Conflict with another plugin or even with a server setting
- Incompatible plugin or theme with latest PHP version
Don’t panic when you see errors in the browser interface or in the admin panel. Since you need to frequently update the WordPress core, PHP version, theme, and plugins, errors often occur due to compatibility and other reasons.
Why should you track PHP errors?
Keeping a close eye on PHP errors on your site is critical in two main ways.
- Security – PHP error information can expose your site to malicious attacks. Therefore, understanding and correcting errors is a mandatory task to maintain the security and reliability of a website.
- Optimization – PHP errors can slow down your website speed and if these problems go undetected, they can slow down performance and waste bandwidth.
Although many default installations do not provide notification of these issues, PHP problems often occur unexpectedly and without warning. Even minor changes to your website can cause them to change in your server settings, database setup, or WordPress files.
The truth remains, even if your site looks fine on the outside, it may be suffering from subtle PHP issues that need to be addressed immediately. And that’s why WordPress administrators need to watch out for PHP errors.
Debugging PHP Errors in WordPress
In this article, we will look at how to debug PHP errors in WordPress in two ways.
- Debug PHP errors manually with code.
- Debug PHP errors with plugins.
1. Debug PHP errors manually with code
We will look at three basic PHP constants:
| WP_DEBUG | Enable debug errors |
| WP_DEBUG_DISPLAY | Displaying Errors in the Browser Web Interface |
| WP_DEBUG_LOG | Enable logging errors to a log file |
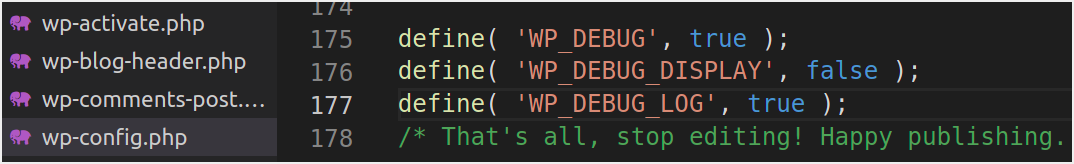
WP_DEBUG and WP_DEBUG_DISPLAY

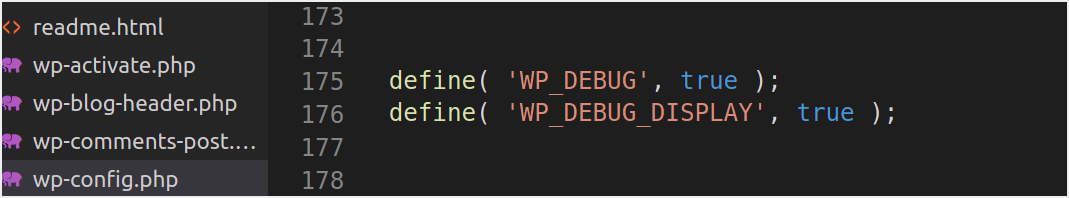
define( 'WP_DEBUG', false );It should look like the image below.

define( 'WP_DEBUG_DISPLAY', true );With both options enabled, it should look like the image below.
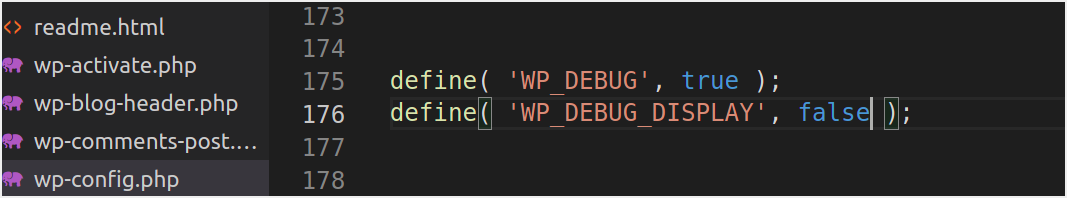
Error Log with WP_DEBUG_LOG
- Your entire site is down.
- Notice the blank screen when trying to open the site
- Problems with the performance of your site
- You receive a warning with HTTP status codes 401, 404, or 500
- If a plugin or theme is not working correctly. You may also want to consider creating error logs to get more details about the problem.

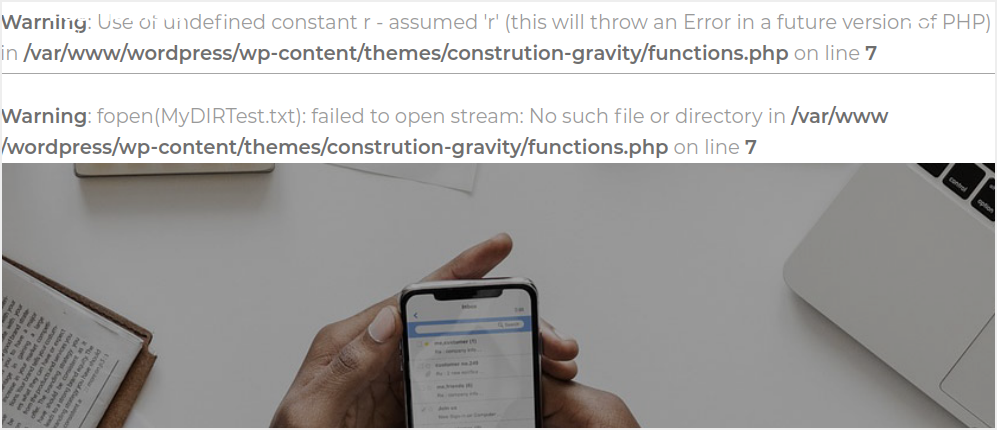
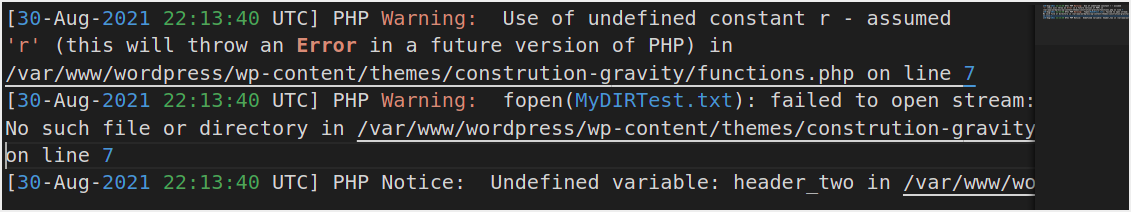
When we open the file, you can see that it contains all the errors that were displayed on our site.
2. Debugging PHP errors with plugins
Debugging PHP Errors with the WP Debugging Plugin
The Debug WP plugin is a free WordPress plugin that launches WordPress debug mode and allows you to log errors. This plugin sets debugging constants in wp-config.php when activated and removes them when deactivated. When problems occur, a PHP exception is thrown. These constants include:
define( 'WP_DEBUG'; true );
define( 'WP_DEBUG_LOG'; true );
define( 'SCRIPT_DEBUG'; true );
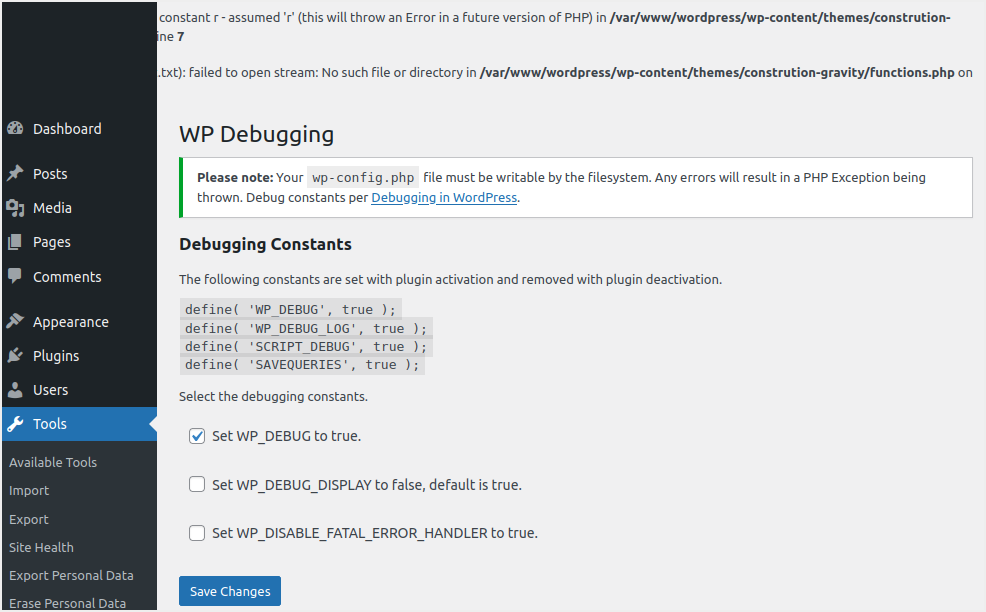
define( 'SAVEQUERIES'; true );When a plugin is deactivated, every effort is made to restore the state of existing constants. However, the default settings and all saved settings are restored when the plugin is reactivated. The plugin also has a debug section where you can set up debug constants. To start;
- Go to your WordPress dashboard and click on the Tools menu.
- Click the “WP Debugging” submenu.
- Scroll down and select the debugging constants you want to apply to your site.
- Click the Save Changes button to apply the changes as shown in the image below.
Debugging PHP Errors with the Query Monitor Plugin
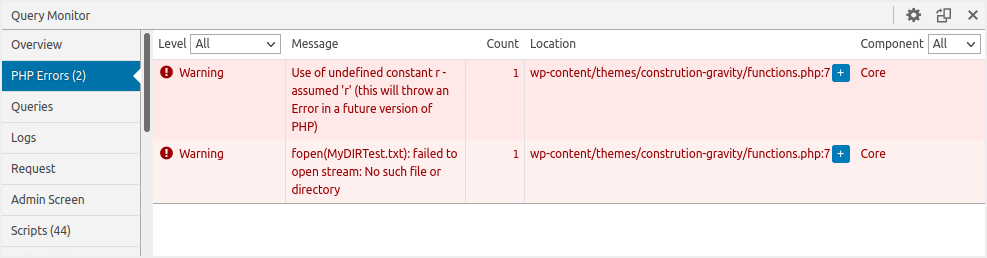
Query Monitor is a free WordPress plugin that helps web administrators analyze web page and web page requests. It will also alert you to serious PHP errors among its many uses. You will see the new item in the top admin panel after installing and activating it. When it identifies a critical (PHP) issue, the toolbar turns red, as shown in the image below.

This dashboard contains a drop-down menu with several options that you can use to manage your WordPress site. However, in this post, we will only focus on PHP errors. Hover over the newly appeared “Query Monitor” toolbar and click “PHP Errors”. This will open a window with all the PHP errors on your WordPress site, as shown in the image below.
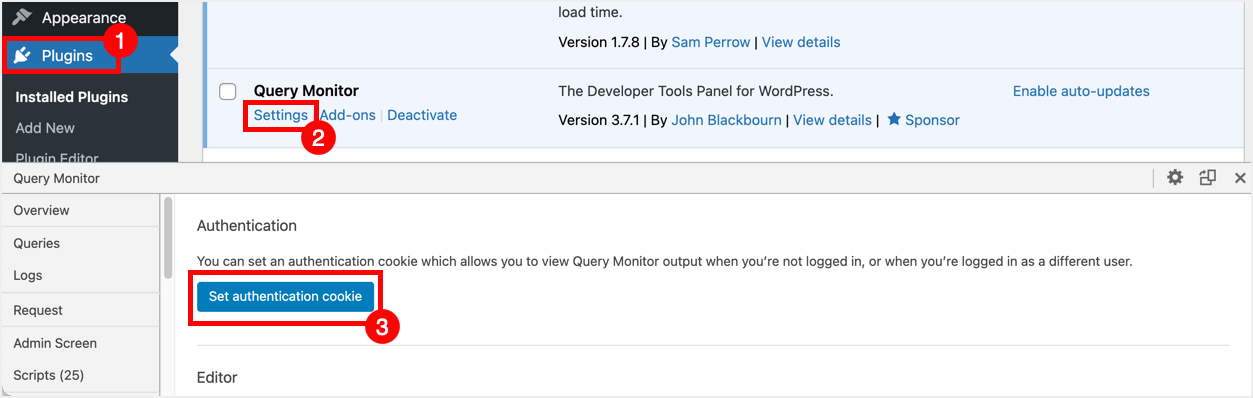
In addition, you can set an authentication cookie that allows you to view Query Monitor output when you are not logged in or when you are logged in as a different user. To do this, follow these steps:
- Go to the Plugins section of your WordPress dashboard.
- Click on the “Settings” option under the Query Monitor plugin.
- A developer console window will appear on your admin panel.
- Click “Set Authentication Cookie”.